Tuesday, February 14, 2012
Great new site!
The Cult Of Money blog is a great personal finance site. I would highly recommend that everyone go there and take a look.
Saturday, April 23, 2011
Portfolio performance for the week ending April 22th...
So the rotational model is still heavy into Energy, Commodities, and Domestic Small Caps with 15% weightings, underweight Foreign Developed and Foreign Bonds, and out of Domestic Bonds as they are below their 40 week moving average.

The portfolio details are shown below for the particular asset classes mentioned above. VDE (Energy) holdings are 10% along with VB (Small Cap) and VV (Large Cap).

The portfolio results for the monthly trading system are shown below. Out-performance of the portfolio compared to the SPY was .62% for the week, basically recouping the under performance of the prior week.

The performance of the weekly updated performance was slightly better than the monthly portfolio. However, this was likely offset by the trading costs.

Sunday, April 17, 2011
Rotational model update for week ending April 15th...
The rotational model is still heavy energy, commodities, and domestic small caps. VDE and VB are both 10% holdings as they are both holding for the core and happen to be the best performing of the sub-sectors also.

The current portfolio if you were following the weekly updates is shown below. If you are trading based on the monthly portfolio, those obviously haven't changed yet and no 40 week SMA (nor 20 week SMA) price violations have occurred.

Tomorrow we start again on the slow slog toward returns.

The current portfolio if you were following the weekly updates is shown below. If you are trading based on the monthly portfolio, those obviously haven't changed yet and no 40 week SMA (nor 20 week SMA) price violations have occurred.

Tomorrow we start again on the slow slog toward returns.
Friday, April 15, 2011
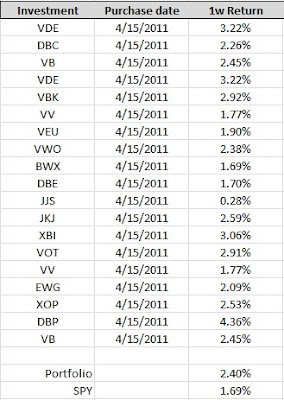
Portfolio performance for the week ending April 15th...
So this week the energy and commodity sectors were particularly weak. With the model over-weighting these based on the recent past performance, the portfolio was down compared to the SPY, and the model has underperformed since we started 2 weeks ago.

With last weeks performance, the model has underperformed the SPY by about .75% over the last two weeks. This is the originally purchased portfolio which is traded on a monthly basis (other than any 40 week moving average violation).
The portfolio that updates on a weekly basis had slight underperformance compared to the original.

With the energy and commodities under-performing, I would expect either continued weakness and perhaps an intermediate top, or to see a reversal. However, I don't trade on feelings, I wait for signals and over the long term plan to outperform and maintain capital.
BTW, I am also looking at trading off the 20 week moving average, as back tests have shown that at the expense of more trades and a lower win percent, both returns are increased and drawdowns are lessened. This will be a topic for a future post.
Tuesday, April 12, 2011
You can't have losses and still do well...
One of the things that I really try to limit is losses (duh). But you may be more aggressive about doing the same when you see the following. First, is a great quote From Ken Fisher, Forbes, 1989:


Here’s the paradox: The odds are overwhelming I will end up richer by aiming for a good return rather than a brilliant return -- and sleep better en route. Folks who seek a killing usually get killed. Gunslingers get shot, and often in the foot, with their own guns. While there is always some guy around on a red-hot streak, his main function is to tempt the rest of us into becoming fools and paupers. A return of 15% to 20% annually is a lot more than most folks realize, or need. If a 30-year-old with $10,000 in an IRA gets 15% annually, he’ll be a millionaire before normal retirement. That’s the power of compound interest. If that same 30-year-old were to sock away another $2,000 per year at 15%, he would end up as a 65-year old $3 million fat cat. At 20%, it’s an incredible $13 million. That’s a lot, but it’s not too much to ask. The two most definitive studies ever on long-term returns, the Ibbotson/Sinquefield and Fisher/Lorie studies, both point to average annual returns for stocks of 9% plus per year going back to the mid-1920s. So 15% to 20% per year is really 66% to 100% better than the market as a whole. That’s tough but doable. Consistency is the key. It is close to impossible to get a good, long-term, rate of return if you suffer serious negative numbers en route. It’s the math. A single year that is down 30% means you have to get 30% per year positive returns for the next four years to get back on track for a 15% annual average. Or, if you score 20% annually for four years, and then suffer a 30% decline, your five-year average return is only 7%.
A big quote I know, but important. If you have a large loss, it really is almost impossible to get back to were you would be if you had a more consistent yet lower return.


If you have a method that can return 10% annually, first off you are doing pretty well. But if you're shooting for the stars, looking to make the "quick buck", you may want to re-evaluate. Looking at the returns required over the next 4 years after a loss that must be averaged in order to get back to that 10% annual return. A 20% loss in the first year requires 4 years of almost 20% returns. That is going to be pretty tough, especially without taking on even more risk.
The moral of the story: Protect capital, even at the expense of higher returns, because it is very difficult to recover.
Friday, April 8, 2011
Portfolio performance for the week ending April 8th...
The first week of the portfolio holdings showed slight out-performance compared to the SPY. This is calculated as a week ago Friday close to Friday close.

Granted this was a slight difference, but over time, a weekly 25 basis point performance comes to over 12% annualized. I am tracking several portfolios concurrently, one that trades once a month, and one that trades weekly. I will give weekly updates to this portfolio even if it only trades once per month (other than the automatic stop level at the 40 week SMA).
If you were to start a new portfolio this month, or trade weekly, here is the weekly portfolio:

And here are the top performing asset classes:

Compared to last week, the Domestic Large Cap and the Value / Growth Strategies swapped places.
Thursday, April 7, 2011
Goals and risk management...
I thought I would back up and cover my goals for investments, and why I invest in only ETFs.
My overall goal is to maximize my returns give a few conditions. I want "limited" risk, I want low draw downs (aka low downside volatility), and I don't want to spend hours and hours every day managing my money.
So, the limited risk I achieve by owning only ETFs. I also consider mutual funds, but I prefer to exit at a price I know instead of the end-of-day price. Additionally, I have been burned by previous ownership in individual names announcing bad news that then blows through stops. The ETFs hold multiple names so this type of single name shock.
Diversification is another method I use to limit risk. My asset allocation model limits the amount of any one instrument that I can hold to 5% usually, or 10% under certain circumstances.
The limiting of risk and the low draw down I achieve by following a simple timing model much like Mebane Faber of the Ivy Portfolio fame. I use the 40 week moving average, which is nearly equivillent to the 10 month moving average that he expounds in his papers & books. It is just easier for me to get data on the 40 week average than the 10 month.
Finally, I have limited time, and as they say time is money, so I want a systematic way to determine investments, make the trades, and move on. My model does that, and attempts to limit trades to the minimum necessary.
Subscribe to:
Posts (Atom)